1. line chart에서 legend 색 마킹 테두리말고 전체 색 마킹 설정
AS-IS

TO-BE
설정 방법
this.myChart = new Chart(ctx, {
    type: 'line',
    data: {
       // ...
       label: 라벨 이름,
       // 👇 backgroundColor 설정
       backgroundColor: tagColor,
       // 👇 borderColor 설정
       borderColor: tagColor,
       data: 차트 데이터
    },
    backgroundColor: /*...*/,
    options: { /*...*/ }
 }
2. barchart에서 bar width 크기 조절

data.datasets[0].barThickness 각 bar의 두께(width) 조절
...minBarThickness: 최소 bar의 두께 설정
maxBarThickness: 최대 bar의 두께 설정
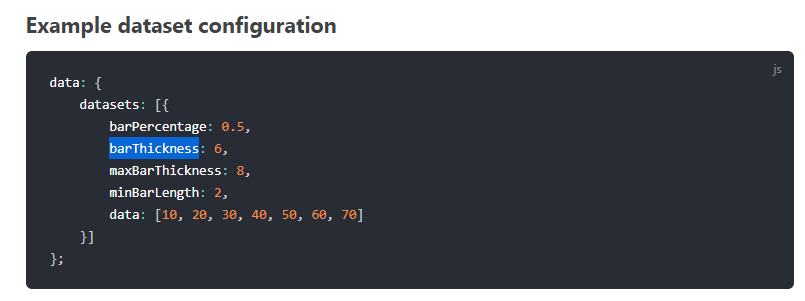
참고 https://www.chartjs.org/docs/next/charts/bar.html#example-dataset-configuration
Bar Chart | Chart.js
Bar Chart A bar chart provides a way of showing data values represented as vertical bars. It is sometimes used to show trend data, and the comparison of multiple data sets side by side. const config = { type: 'bar', data: data, options: { scales: { y: { be
www.chartjs.org
chart에 바운더리(경계) 선 표시하기
아래 처럼 빨간 선을 차트 내에 표시하는 것을 annotation이라고 합니다. chartjs관련 라이브러리를 사용했습니다.

라이브러리 이름은 chartjs-plugin-annotation입니다.
👉 https://www.chartjs.org/chartjs-plugin-annotation/guide/types/line.html#configuration
저희 제품같은 경우에는 차트를 zoom하는 기능도 필요했기 때문에, zoomPlugin이라는 차트 라이브러리도 함께 사용했습니다.
기능을 적용하면서 어려운 점이 있었습니다.
Chart.register(annotaionPlugin)을 하는데, 개발자 도구에 콘솔에 Maximum call stack 에러가 계속 띄는 것이었습니다.
제가 chart 인스턴스를 만들어 주는 코드는 다음과 같았습니다.
<template>
    <canvas :id="`canvas-${index}`"></canvas>
</template>

<script>
import { Chart, LineElement, PointElement, LineController, CategoryScale, LinearScale, LogarithmicScale, RadialLinearScale, TimeScale, Decimation, Filler, Legend, Title, Tooltip } from 'chart.js';
import zoomPlugin from 'chartjs-plugin-zoom';
import annotationPlugin from 'chartjs-plugin-annotation';  // 👈
Settings.defaultLocale = 'en';

Chart.register(
    LineElement,
    PointElement,
    LineController,
    CategoryScale,
    LinearScale,
    LogarithmicScale,
    RadialLinearScale,
    TimeScale,
    Decimation,
    Filler,
    Legend,
    Title,
    Tooltip,
    zoomPlugin,  // 👈
    annotationPlugin // 👈
);
Chart.defaults.font.size = 10;

export default {
    props: {
        chartData: {
            type: Object,
            default: null,
        },
        chartOptions: {
            type: Object,
            default: null,
        },

        isZooming: Boolean,
        timeLineMode: Boolean,
    },
    data() {
        return {
            myChart: null,
        };
    },
    mounted() {
        this.fillData();
    },
    methods: {
        fillData() {
            const ctx = document.getElementById(`canvas-${this.index}`).getContext('2d');
            this.myChart = new Chart(ctx, { // 👈
                type: 'line',
                data: this.chartData,
                options: {
            		// ...
                    plugins: {
                        // ...
                        autocolors: false,
                        annotation: {
                            annotations: {
                                line1: {
                                    type: 'line',
                                    yMin: 20,
                                    yMax: 20,
                                    borderColor: 'rgb(255, 99, 132)',
                                    borderWidth: 2,
                                },
                            },
                        },
                        zoom: {
                            animation: {
                                duration: 0,
                            },
                            zoom: {
                                drag: {
                                    enabled: !this.timeLineMode,
                                    borderColor: '#cfcdd3',
                                    borderWidth: 1,
                                    backgroundColor: '#cfcdd34d',
                                },
                                wheel: {
                                    enabled: this.isZooming,
                                    speed: 0.3,
                                },
                                mode: 'x',
                                onZoomComplete: ({ chart }) => {
                                    this.$emit('onZoom', { min: chart.scales.x.min, max: chart.scales.x.max });
                                },
                            },
                        },
                    },
                    scales: {
                        // ...
                    },
                },
            });
        },
        updateChart() {
            if (this.myChart) this.myChart.destroy();
            this.fillData();
        },
    },
};
</script>
new Chart로 chart 인스턴스를 선언해주는 부분에 보시면, myChart라는 컴포넌트 상태 프로퍼티에 인스턴스를 대입해주고 있습니다. 이 부분에서 잘못된 거 같습니다.
그래서, 변수에 대입하는 것을 빼고 인스턴스 생성만 해주니, 깔끔하게 에러는 사라졌고, zoomplugin도 정상 작동하는 것을 확인할 수 있었습니다.
new Chart(ctx, ...)원인을 찾아보니..
chart 인스턴스를 컴포넌트 상태 프로퍼티에 대입하지 마라고 하네요..
추가로..
annotation(선)에 라벨링도 할 수 있습니다.


사용 방법
문서 링크 👉 https://www.chartjs.org/chartjs-plugin-annotation/guide/types/line.html#label
Line Annotations | chartjs-plugin-annotation
Line Annotations Line annotations are used to draw lines on the chart area. This can be useful for highlighting information such as a threshold. const options = { plugins: { autocolors: false, annotation: { annotations: { line1: { type: 'line', yMin: 60, y
www.chartjs.org
options.annotations[annotationID].label 에 옵션을 적용하면 됩니다.
enabled가 기본 false여서 true로 해주셔야 label이 보입니다.
methods: {
  makeXMinBoundaryAnnotation() {
            if (this.$route.params.mode === 'event') {
                const annotationX = {
                    type: 'line',
                    👉 label: { content: 'min', enabled: true, backgroundColor: 'red', position: 'end' },
                    yMin: this.$route.query.range_min,
                    yMax: this.$route.query.range_min,
                    borderColor: 'rgb(255, 99, 132)',
                    borderWidth: 2,
                };
                return annotationX;
            }
            return null;
        },
        makeXMaxBoundaryAnnotation() {
            if (this.$route.params.mode === 'event') {
                const annotationX = {
                    type: 'line',
                    👉 label: { content: 'max', enabled: true, backgroundColor: 'red', position: 'end' },
                    yMin: this.$route.query.range_max,
                    yMax: this.$route.query.range_max,
                    borderColor: 'rgb(255, 99, 132)',
                    borderWidth: 2,
                };
                return annotationX;
            }
            return null;
        },

         fillData() {
            const ctx = document.getElementById(`canvas-${this.index}`).getContext('2d');
            const annotationXMin = this.makeXMinBoundaryAnnotation(); 👈
            const annotationXMax = this.makeXMaxBoundaryAnnotation(); 👈
            const annotationY = this.makeYBoundaryAnnotation();
            const sChart = new Chart(ctx, {
                type: 'line',
                data: this.chartData,
                options: {
					// ...
                    plugins: {
                    	// ...
                        annotation: {
                            annotations: {
                                annotationXMin, 👈
                                annotationXMax, 👈
                                annotationY,
                            },
                        },
                    },
                    scales: {
                    	// ...
                    },
                },
            });
}
4. y축 제로베이스에서 시작하기
참고 👉 https://www.chartjs.org/docs/latest/charts/bar.html
const config = {
  type: 'bar',
  data: data,
  options: {
    scales: {
      y: {
        beginAtZero: true
      }
    }
  },
};
const config = {
  type: 'bar',
  data: data,
  options: {
    scales: {
      y: {
        beginAtZero: true  //👈
      }
    }
  },
};
5. xAxis ticks 보이는 개수 제한하기

scales: {
   xAxis: {
      ticks: {
         autoSkip: true,  // 👈
         maxTicksLimit: 10  // 👈
      }
}'라이브러리 도구' 카테고리의 다른 글
| [VSCODE] Github에 코드 올리는 방법 (0) | 2021.12.26 |
|---|---|
| [chart.js in vue.js] data label 없애는 설정 방법 (0) | 2021.11.11 |
| [chartjs] tooltip 설정 방법 (2) | 2021.11.08 |
| tailwindcss 사용법 알아보기 (0) | 2021.11.06 |
| [dayjs]빼기 더하기 하는 방법 (0) | 2021.10.13 |


댓글